
This year, I’m attending the 2026 Nonprofit Technology Conference virtually. You may recall I said yesterday that I would only make one, updated post. Guess what, though!? I have too much to say. So we’re back to our previously scheduled format, and off to the races on Day 2!
Creating ethical AI tools: Lessons from an anti-trafficking nonprofit
Sandra Diaz (Restore NYC), Sara Hashim (Forest & Trees), Sam Raddatz (Forest & Trees)
Collaborative Notes for “Creating ethical AI tools: Lessons from an anti-trafficking nonprofit”
Slides for “Creating ethical AI tools: Lessons from an anti-trafficking nonprofit”
Important note that wasn’t clear up front: This project is not complete and hasn’t launched yet. Based on that, the case study format of this session (NTC recommended following the “Chatham house rule”), and the sensitivity of the use case, I’m not going to post my notes for this session.
However, I will share some take-aways that I personally had in reaction to the presentation. Some of these were consistent with the presentation and others weren’t, so they really don’t imply much about the details of this project:
- AI is in the “move fast and break things” phase of development, and I find it extremely concerning to apply it to any part of any process involving a vulnerable population. (The presentation talked about ensuring stakeholder voices are consulted and the risks of doing this.)
- AI is currently a hammer seeking nails. Many projects are seeking to use AI to solve a problem without asking—clearly enough or at all—what other solutions and approaches could be as or more effective.
- When listening to people discuss using AI, it’s rare to hear clearly described concrete ways in which things could go wrong and cause negative impacts. Doing these types of “premortem” exercises seems really crucial when considering using AI in nonprofits.
- People know when they’re talking to chatbots and there many situations in which they find that unacceptable, unsafe, or untrustworthy. Organizations need to consider the risks to the trust they’ve built in their communities when implementing any public-facing AI tools.
Breaking The Spell: Superstitions Holding Back Volunteer Engagement Strategies
Terra Gillespie (Terra Etc), Jessica Pang-Parks (Learn with JPP)
Terra offers some really cool-looking free Tools for Solidarity resources.
A rough stat to start: 24% of people in a survey in Toronto never heard back after applying to volunteer with an organization. For many others, it took 2+ weeks (even 3+ months!).
I extra need this presentation for the work I do as president of the board for my school’s Parent-Teacher Organization (PTO).
Superstitions about volunteering:
- “Best volunteers are retired, middle-class…have free time” (i.e., they are white)
- This excludes BIPOC folks, youth, non-English speakers, working people, disabled people, trans people, people without cars(!), and more. How can you reach a diverse community without diverse volunteers?
- Remember that our baseline assumptions of volunteerism are rooted in white women who stayed at home in the 1950s. That’s not what life looks like anymore!
- A volunteer is equivalent to unpaid staff
- There is a broad trend in the nonprofit sector of increasing need and stagnant or reduced resources leading to increased staff burnout. Using volunteers as unpaid staff will burn them out.
- Volunteers are not a cost-saving program and can provide long-term value to the organization if treated well.
- Volunteers are driven by incentives and gifts.
- ⭐ Volunteers come back because they have a good experience.
- Volunteering is down post-COVID because people don’t want to be in-person.
- This might be partially true. Can we create online ways for people to volunteer?
- Examples of virtual volunteering:
- Graphic design / social
- Online mentoring and coaching
- Online peer support
- Virtual fundraising and awareness raising
- Remote admin support
- Volunteer management is too much work for too little “ROI” (Return on Investment).
- One study showed that volunteers donate 10x more
- Another showed volunteers were 14.5% more likely to donate
Tips for better volunteer engagement and Inclusive Recruitment
- Respond quickly! (As quickly as you’d respond to a potential donor)
- Use a template to respond to ensure consistent communication. Even better, have a “Welcome series” of emails (see below)
- Creating opportunities that are available to people with different life schedules and abilities. That includes short-term and project-based opportunities.
- Actively address barriers; don’t just hope.
- Create a volunteer engagement ladder
- Talk about volunteers as much as you talk about donors (or say “supporters”)
- Create a privacy policy for volunteers—i.e., the process of creating it is valuable. They recommended a tool called Termly.
- Do a volunteer engagement survey
- Only do this if/when you have a purpose and plan to use it. Change things based on feedback.
- Explain the purpose of the survey ahead of time, especially when asking questions about their identity
- Test ahead of time and ensure it’s only 5-10 minutes
- Share finding back with the community
- Allow anonymous (honest) feedback
- “Would you recommend volunteering with this organization” is a good question to track over time
| Purpose | Notes | Timing |
|---|---|---|
| Welcome | Start with gratitude, communicate what they can expect from your org | Immediate |
| Impact Story | Share a story from one of your programs that benefitted from volunteers | 3-5 days after the first email |
| Practical | What should they know as a volunteer? Who will they be working with? Who do they direct questions to? What kind of opportunities will there be? | 5-7 days after first email |
| Values Alignment | Share programs, events, and resources that align with volunteer values of community building | 7-10 days after the first email |
| Forward-Looking | Express gratitude, revisit key points from previous emails, and end on an optimistic note | 10-12 days after the first email |
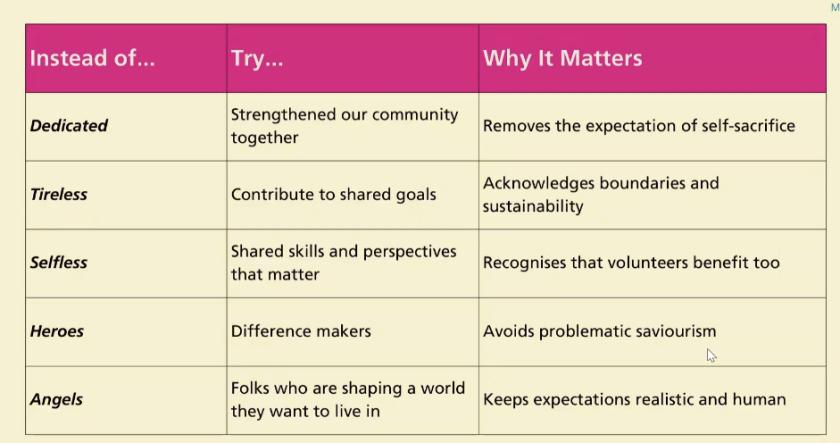
- Instead of “dedication” focus on strengthening community
- Instead of “tireless” focus on contributing to goals sustainably
- Instead of “selfless” focus on sharing skills and perspectives and mutually beneficial volunteering
- Drop “heroes” and “angels” to talk about contributing to the world we want to live in together
A good point during the wrap-up is that there are both formal and informal volunteering. Informal volunteering can include things like helping neighbors, picking up trash, reposting resources on social media, protesters, etc. Both are valuable!
Pie charts are racist
Daniel Alberti (Creative Fundraising Advisors)
Collaborative Notes for “Pie charts are racist”
Session Slides for “Pie charts are racist”
[Instant winner of the best session title competition that only I get to vote in!]
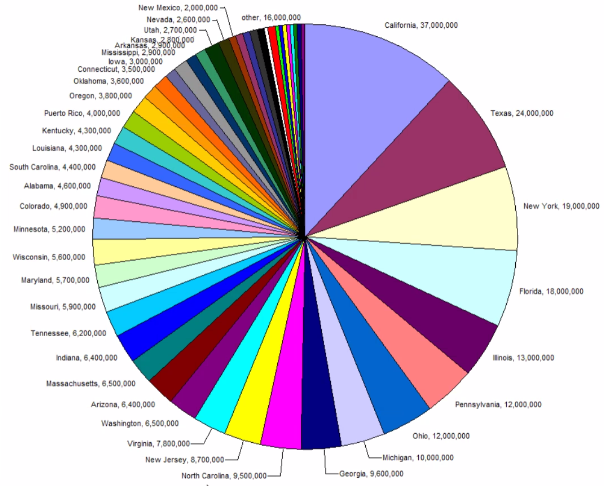
Reasons pie charts are bad:
- Right off the bat: Human eye is bad at understanding comparative slice sizes
- They focus all attention on the big things. Implicit corollary: Small things are less important.
- Often leads to the creation of “Other” categories. Literal “othering”!
Lack of attention and minimization of communities begets lack of attention.
Alternatively, “runaway feedback loops” of incorrectly interpreted data can reinforce the incorrect conclusion in the real world. For example, predictive policing leads to overpolicing which leads to data that suggests it’s “working”.
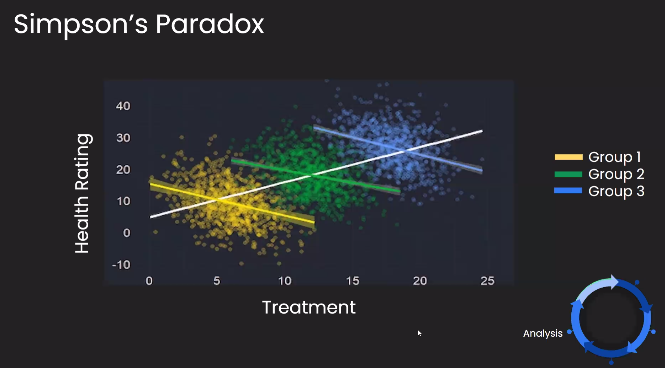
Dan shared this really interesting data issue that was new to me called “Simpson’s Paradox” in which the trendline of a dataset overall can be the opposite of the trendlines within disaggregated populations.
The presentation then turned to “Data Democratization”. Are people able to access the data organization’s collect? If not, why? Are there technical or other access barriers to that data, even if it’s theoretically accessible?
Illustrating problems with data collection, the presentation ended with the story of Abigail Echo Hawk who showed that bad data collection drastically undercounted the number of missing and murdered indigenous women and has fought to make federal data more accessible.
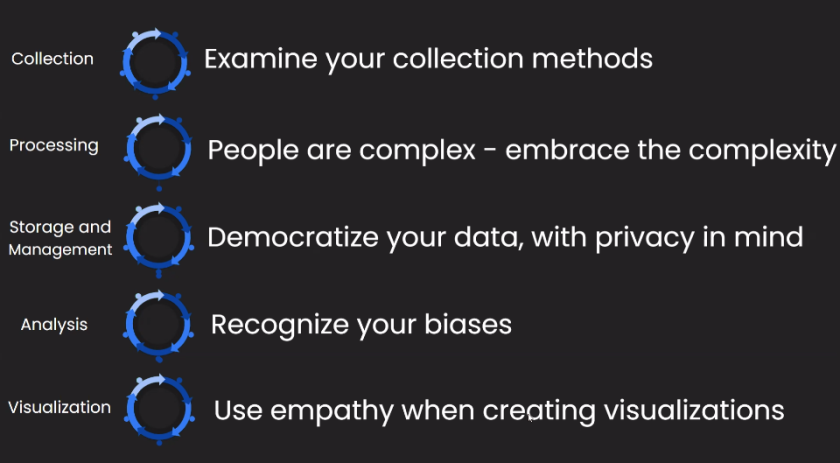
For each step in the cycle of using data:
- Collection: Examine your collection methods
- Processing: Embrace the complexity of people
- Storage and Management: Democratize your data with privacy in mind
- Analysis: Recognize your biases
- Visualization: Use empathy when creating visualizations
When making data visualizations, consider how the people represented in the data will interpret and respond.
Time flies when you’re learning! One more day of NTC coming up tomorrow!